Brave & Alidade Strategies - Financial Report Table Extraction
Alidade Strategies is a boutique consulting firm that helps enterprises embrace digitization and cutting-edge technologies. One flagship product Alidade is trying to build is the capability to batch extract and process large amounts of finance reports in various formats such as PDFs, webpages, etc.
Alidade hired John from Brave to take on this challenge. This work has two parts. The first part is the table location, extraction and saving, and the second part is insights finding. This post will focus on the first part. Below is John’s writing on this project with minor modifications from his blog.
Introduction to Table Extraction
A very accurate model has been developed by a team at Microsoft [1]. They trained their DETR (End-to-end Object Detection with Transformers) -based model on a very large dataset of approximately 1 million annotated tables. The original tables were scraped from the PubMed Central Open Access (PMCAO) database. The Microsoft team also formulated their own scoring criteria, Grid Table Similarity (GriTS), for assessing the accuracy of their model [2].
The entire table extraction process is best divided into these main steps:
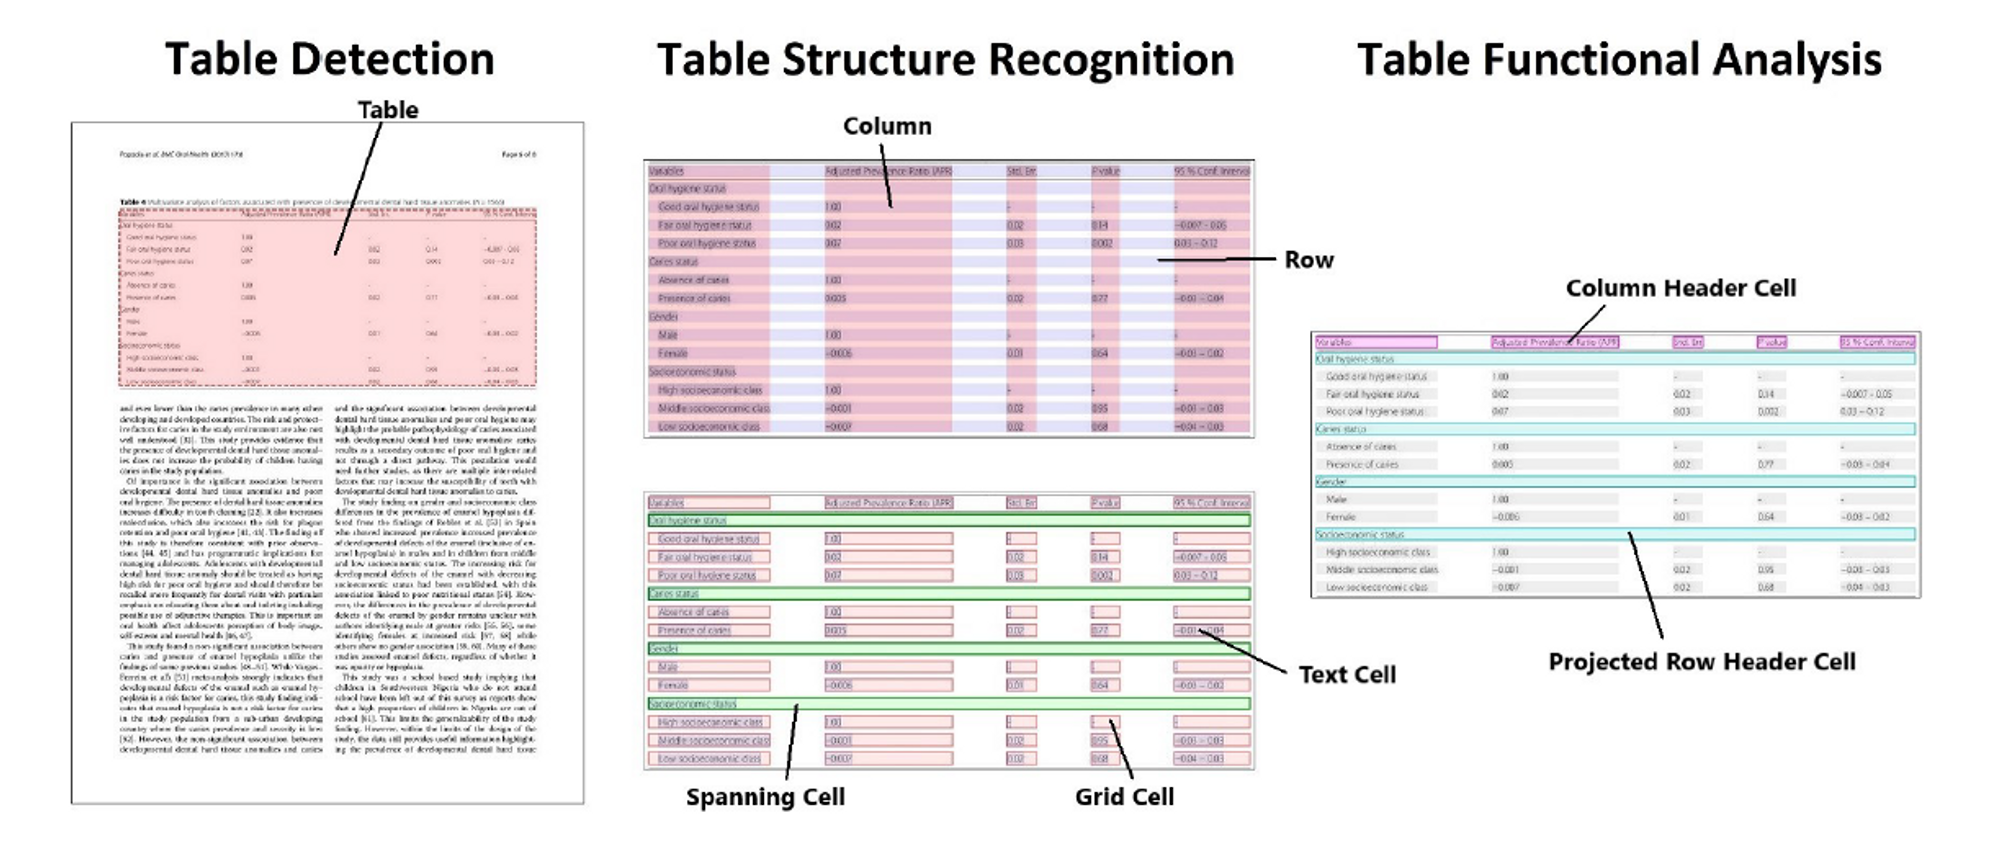
Table Detection (TD): Finding the table in a page or document
Table Structure Recognition (TSR): Recognizing the fundamental features of a table such as rows and columns
Functional Analysis (FA): More advanced detection of functional features of the table such as column headers and project row headers
Data Extraction (DE): Extracting the content of the table into a relational database (e.g. dataframe, excel, or csv file)
This figure is taken from reference [1]. Illustration of the first 3 subtasks of table extraction.
Example of table detection (TD) on a document page. Red box is drawn from the pretrained TD model. A GriTS score is given shown in the top left in yellow box. Table Structure Recognition (TSR) on the same table in the previous figure. With TSR and FA, the model can identify 5 distinct features of a table depicted in the figure below.
Fortunately, steps 1–3 can be done by the pre-trained Microsoft table transformer model available on Hugging Face. There’s currently no ML model for step 4, data extraction, so I have to build a custom solution.
OCR choices: Google Vision vs Pytesseract
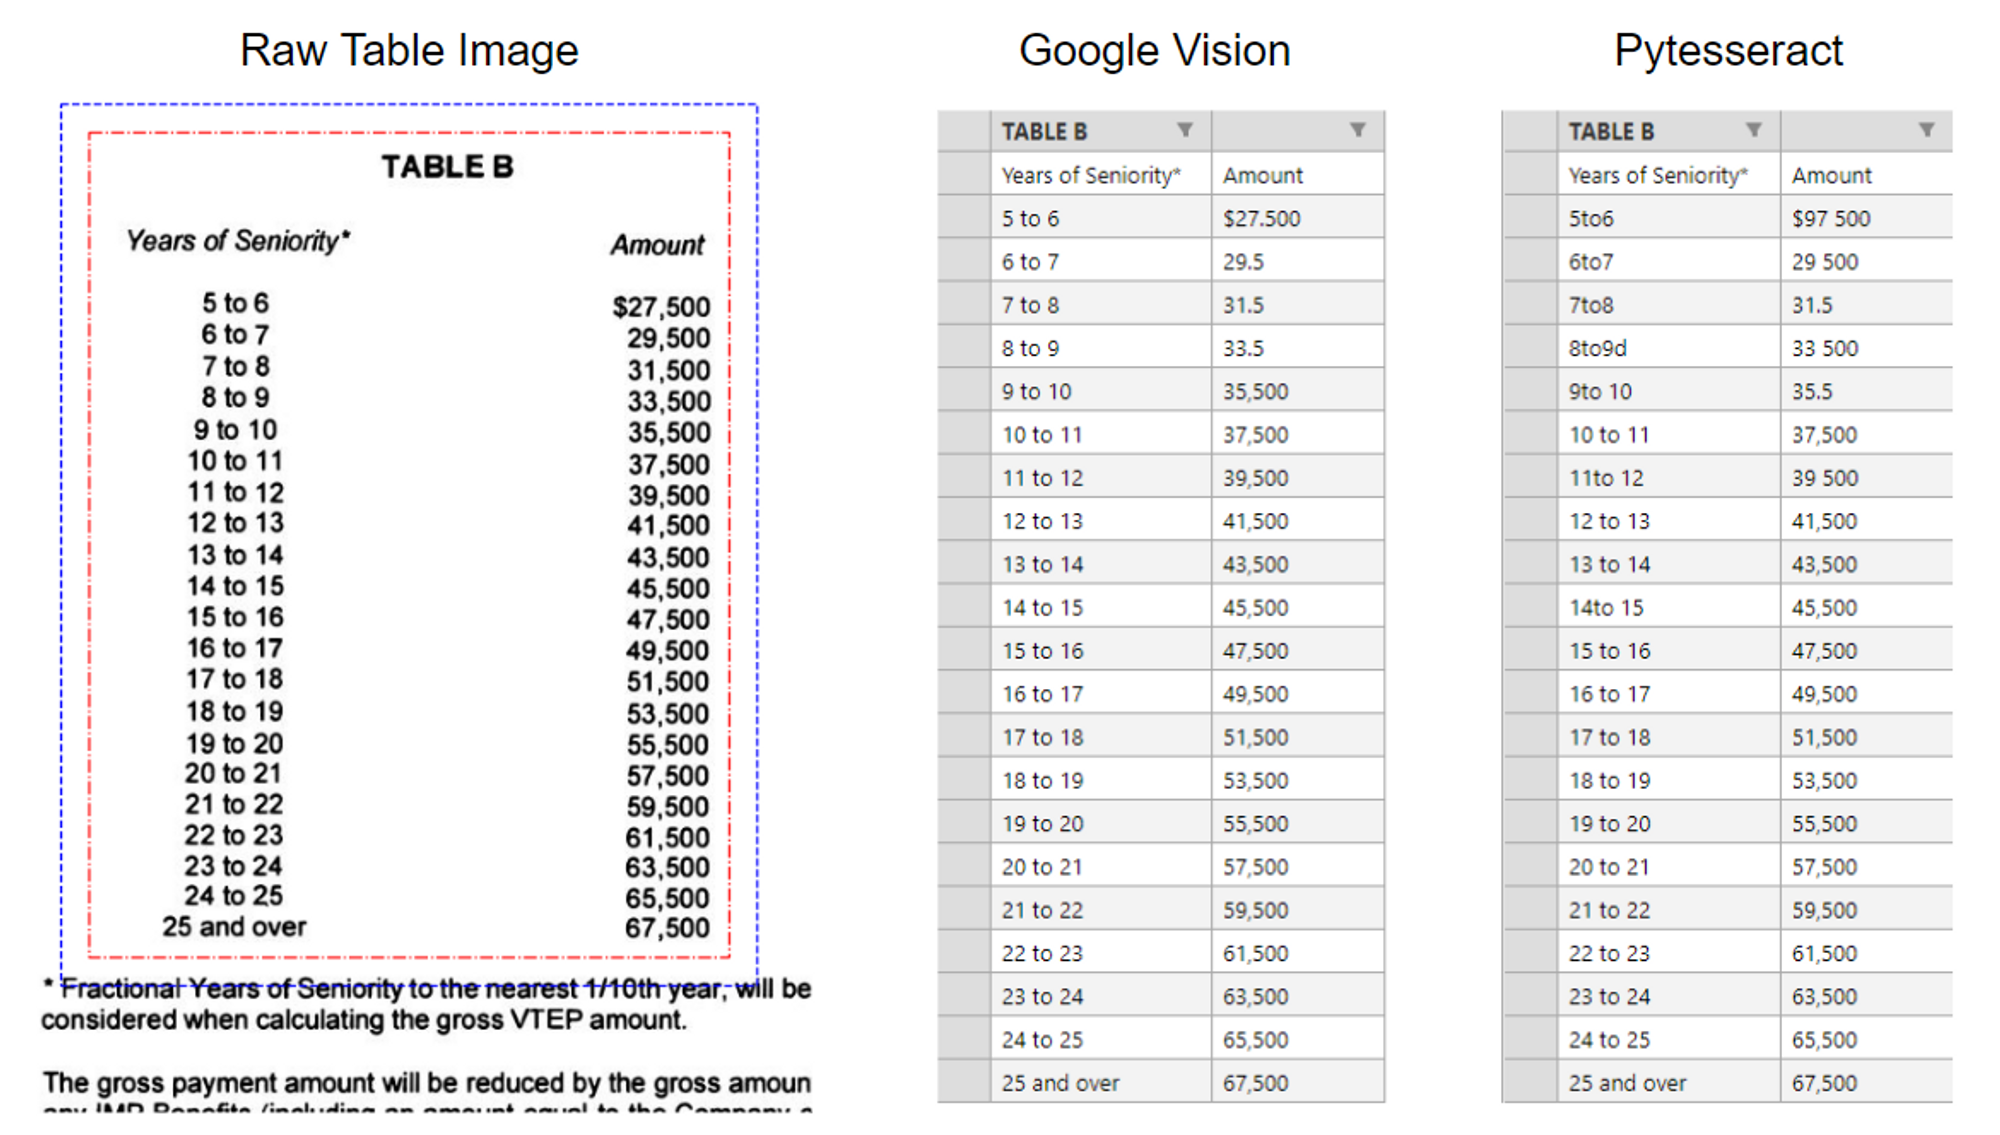
The last few steps of the pipeline involve applying OCR to images to extract the content of the table cells. There are a variety of OCR tools one can use to perform the task. I decided to test out two common ones: Pytesseract, which is lightweight free, and open-source, and Google Vision OCR.
Notice the incorrect characters in the first few rows of PyTesseract.
Google Vision was able to detect newline breaks and had flawless character recognition. PyTesseract shows a few mistakes and couldn’t recognize the accent on the e.
Google Vision OCR unanimously performs better. It does a better job of recognizing the spacing between characters and non-alphanumeric characters. However, if you plan on using table extraction a lot, Google Vision OCR is only free to a limit. I also notice that Google’s OCR takes 2–3 times longer to run. For the rest of this work, I choose to use Google Vision OCR as the primary tool for extracting tables.
Error Analysis
After running this program many times and observing the table extraction process, I notice a few problems that come up repeatedly.
To keep reading, please go to the original post here.


